THE PROCESS OF RATING

Cars, bikes, trucks, and other Internal Combustion Engine (ICE) vehicles generate energy through combustion. This combustion however is only partial, and the tailpipes release a mix of harmful air pollutants. The quantity of these emissions and the safe limits depend on various factors like vehicle maintenance, driving conditions, fuel type, etc. These vehicles have upstream emissions due to the production and distribution of fuels.

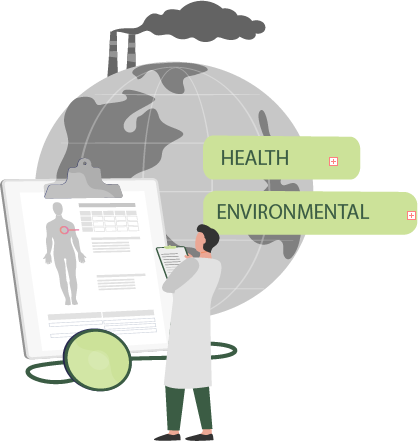
These emissions contribute towards climate warming, extreme weather conditions, low agricultural yields, smog, respiratory and heart diseases, and other health impairments that lead to higher mortality, and increase medical expenses for the common person.

Green Vehicle Rating (GVR) is a tool that calculates the real cost of owning a vehicle after considering the cost of ownership, and the damage to human health, and environmental (climate change, damage to crops, decline in visibility), due to vehicle tailpipe emissions.

HOW DO WE ARRIVE AT GVR?

To calculate the real cost of owning a vehicle, GVR uses the ‘Damage Costs’ methodology. This methodology estimates the monetary cost of upstream and tailpipe emissions, in ₹/km, on your health and the environment. The impact of these emissions vary by pollutant type, source (cars, bikes, trucks etc.), geography and demography .These are known as social costs. They are written in ₹/gm terms, and represent the money needed to undo the damages caused by the release of every gram of pollutant.

The first phase of GVR covered only ICE vehicles and captured tank-to-wheel emissions. In the second phase, the tool now includes Electric Vehicles (EVs), and additional ICE models in the two-wheeler segment. While EVs have zero tailpipe emissions, today, they are mostly powered by coal-fired electricity. This means that GHG emissions and pollutants shift from EVs to power plants. Therefore, to rate EV models alongside ICE-models, we calculate the upstream and tailpipe emissions.

Our Approach: Plant-to-Wheel (PTW) Emissions

ICE Vehicles

EV Vehicles

This approach considers upstream (limited to fuel production, and distribution) and tailpipe emissions (GHGs and air pollutants) due to combustion of fossil fuels. This is important for comparing EVs and ICE as combustion happens within the tank in case of ICE vehicles, and in power plants for EVs.

OUR FIVE STEPS TO RATE A VEHICLE USING GVR

STEP 1: DATA COLLECTION

The first step in the rating process focuses on data collection. Data is collected on air pollutants, GHG emissions, technical specifications of vehicles and price, etc. For ICE vehicles, tailpipe air pollutant data is collected through Form 22, issued by automobile manufacturing companies and emissions from fuel production and distribution from secondary literature. In the case of EVs, pollutant data is estimated using electricity grid emission factor, and other pollutants information, based on secondary research. To estimate emission values for GHGs, data on fuel economy (km/litre) for BS VI models is collated from auto dealer websites, and third-party websites like bikewale.com, droom.com. For EVs, fuel economy is calculated based on range and battery capacity provided by manufacturers on their websites, while technical specifications are collected from third-party websites.

STEP 2: CLASSIFICATION OF EMISSION IMPACT

In the second step, air pollutants and GHG emissions are classified into health and environmental impact. In GVR, health impacts are generated from local pollutants such as carbon monoxide, nitrogen oxides, hydrocarbons, and particulates. Breathing polluted air over a long period causes health issues, and decreases life expectancy.. At national level, this results in heavy economic costs given increased medical expenditure of households, loss in productivity due to illnesses, and loss in workforce caused by early deaths.

Environmental impact is further divided into visibility impact, crop losses, and climate change impact (adverse effects from warming). Both GHGs and air pollutants have environmental effects.GHGs create global and long-term effects that can mostly be controlled from the source,and air pollutants produce localised effects, and visible changes.

STEP 3: MONETISATION

In step three, impacts from air pollutants are quantified in monetary terms,
reflecting damages and risks. This is estimated by unit cost of air pollutants in gm/
kg/tonne. Damage cost factors vary by pollutants, and by region/country. To monetise GHGs impacts, all GHG emissions are converted to carbon dioxide equivalent using global warming potential, and multiplied with the Social Costs of Carbon (SCC).

For EVs, the marginal damage cost could be less compared to ICE vehicles as many thermal power plants are located in places with lower population density. To calculate damage cost estimation due to power plant emissions, the tool uses values for motor vehicles reduced by a factor of 10 due to difference in the exposed population based on a study by McDeluchhi et al (2000). Similar approach is used for damage cost estimation of ICE models upstream emissions as refineries are also located in less populated areas.

Prior to quantifying the impacts, AEEE conducted literature reviews to compile and/or estimate the SCC and the marginal damage costs of air pollutants in India. In the absence of region specific studies, AEEE used the ‘Benefit-Transfer Method’ developed by Sengupta and Mandal (2000) to derive India-specific estimates on marginal costs of foregone environmental resources and public health. The Sengupta study relied on the primary data of McDeluchhi et al (2000).

STEP 4: NORMALISATION

In the next step, the environmental and health damage cost of each model is normalised against the environmental and health costs of a ‘Reference Vehicle’.
In GVR, normalising against a ‘Reference Vehicle’ produces two dimensionless values – environmental rating, and health rating – for each model which are added to create the ‘Damage Score’. The ‘Reference Vehicle’ is an ideal vehicle with a Damage Score of 1. The closer a vehicle’s damage score is to this, the lesser are its negative impacts. For both two and three-wheelers, the ‘Reference Vehicle’ is the cleanest one among the selected models.

STEP 5: CALCULATE COST AND RATING

For each model, the mass of each pollutant/GHG, understood in gm/km, is multiplied with the social cost for that pollutant/GHG, given in ₹/gm. This gives the damage cost from each pollutant/GHG, which are added to produce the total damage cost, due to the upstream emissions, tailpipe emissions and GHGs, for that model. This cost is added to the commonly understood ‘Total Cost of Ownership’ of that vehicle to calculate the ‘Real-World Cost of Ownership’. 40% weight of the composite damage cost is assigned to environmental effects, and the remaining 60% to health impacts, to arrive at a damage score. Based on the damage score, vehicles are assigned a rating on a scale of 1-5, with 5 being the highest.